Usage
To use residuals_weather_storage in a project:
import rws_py
Check especially the two run…py modules and the python scripts in the example folder.
Some quite specific information:
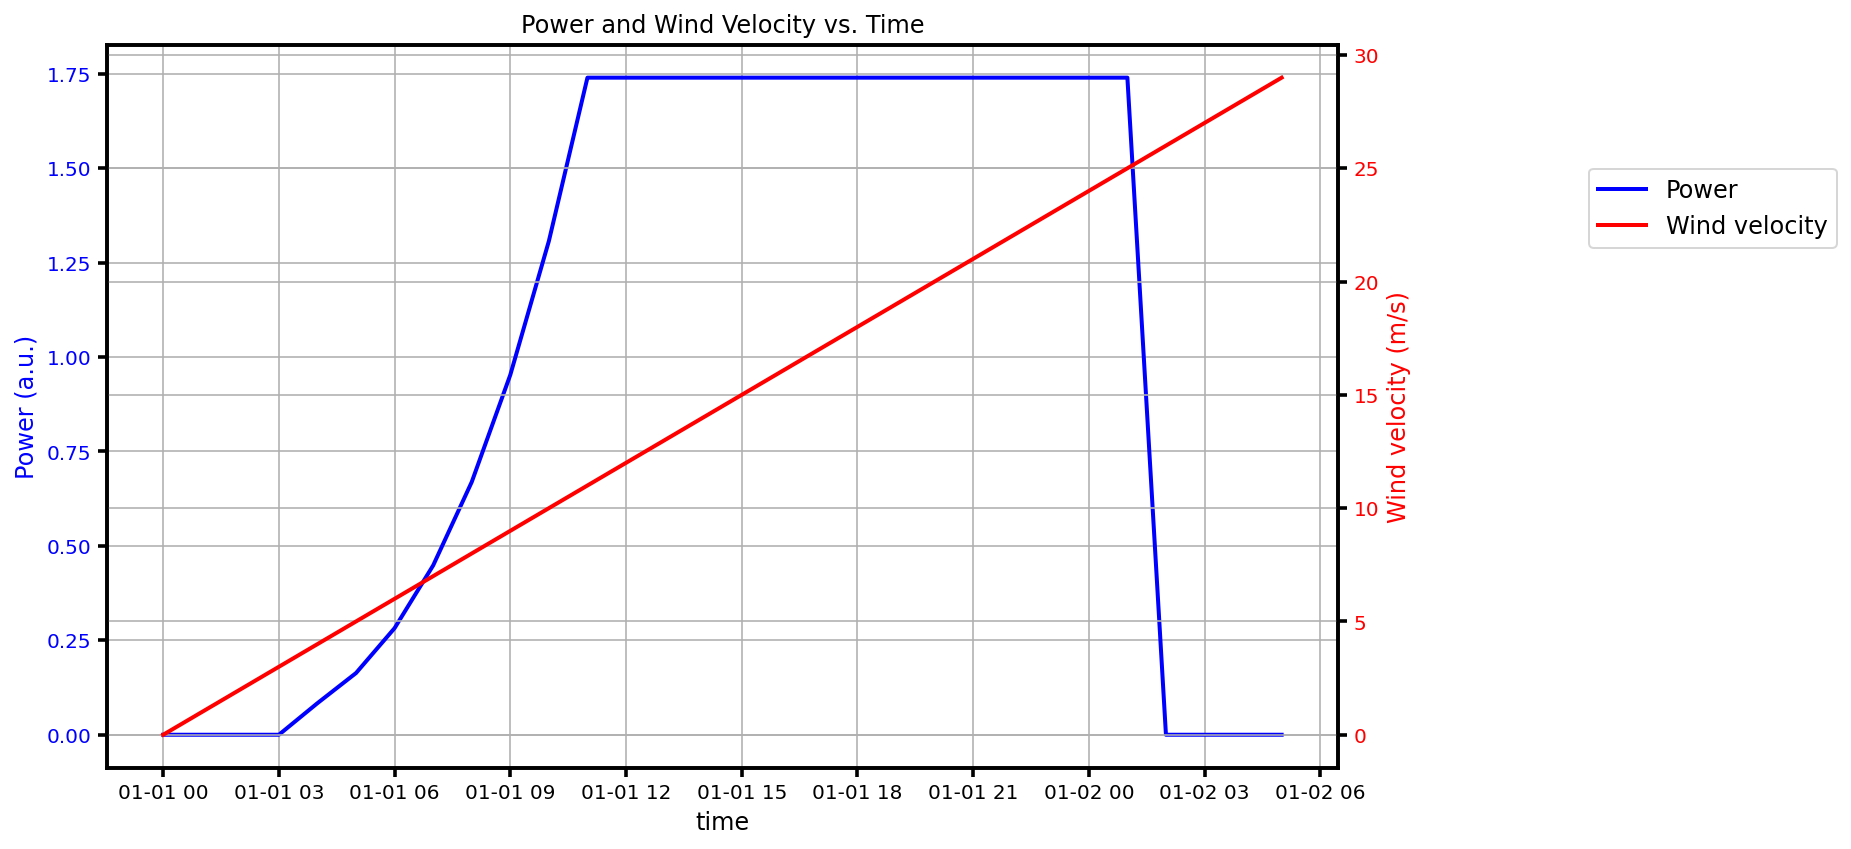
Wind Data
Three limits in velocity are set to calculate the power output as a function of velocity. This is set in dwd_analyze_store_second_threshold.load_data(). The variable wind_bounds=(3.3, 11.0, 25) sets the limits, seen below. The curve is cubic between the first and the second value:
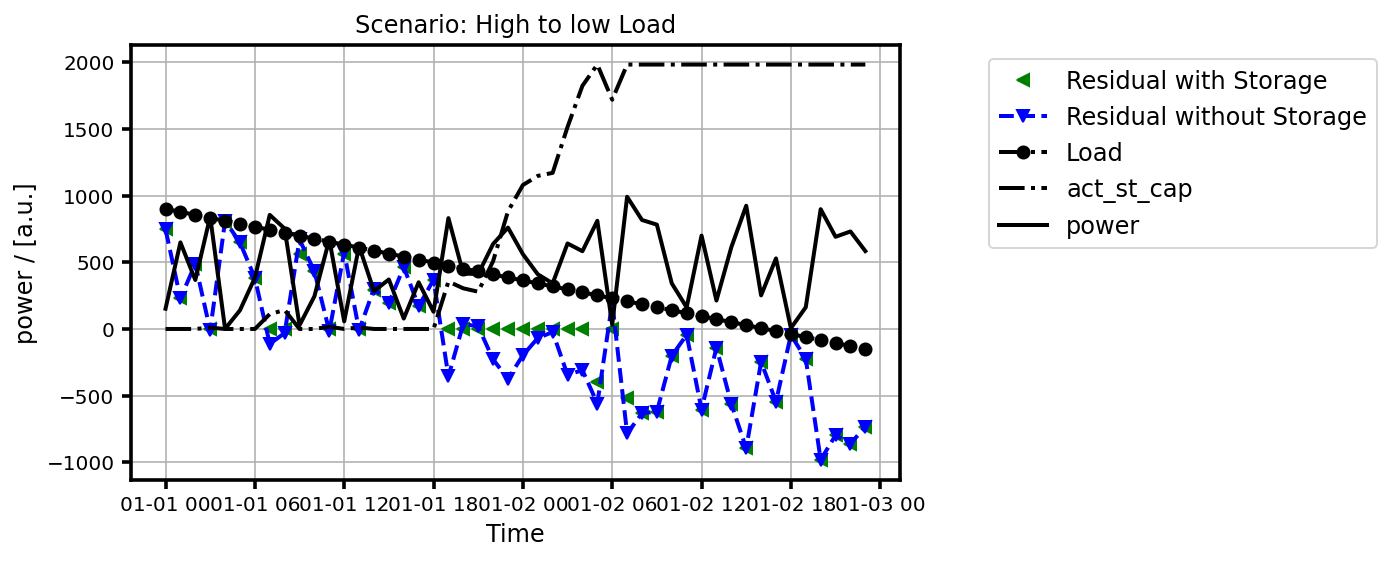
Storage
The energy storage model is very simple and illustrated here. The residual is just P(load) - P(source). The storage has some capacity and no power restrictions. Allways when there is some capacity left and a negative residual, the energy flows into the storage until it is full. Always if the storage is not empty and the residual is positive, the storage will be discharged to fulfill the need or until it is empty.
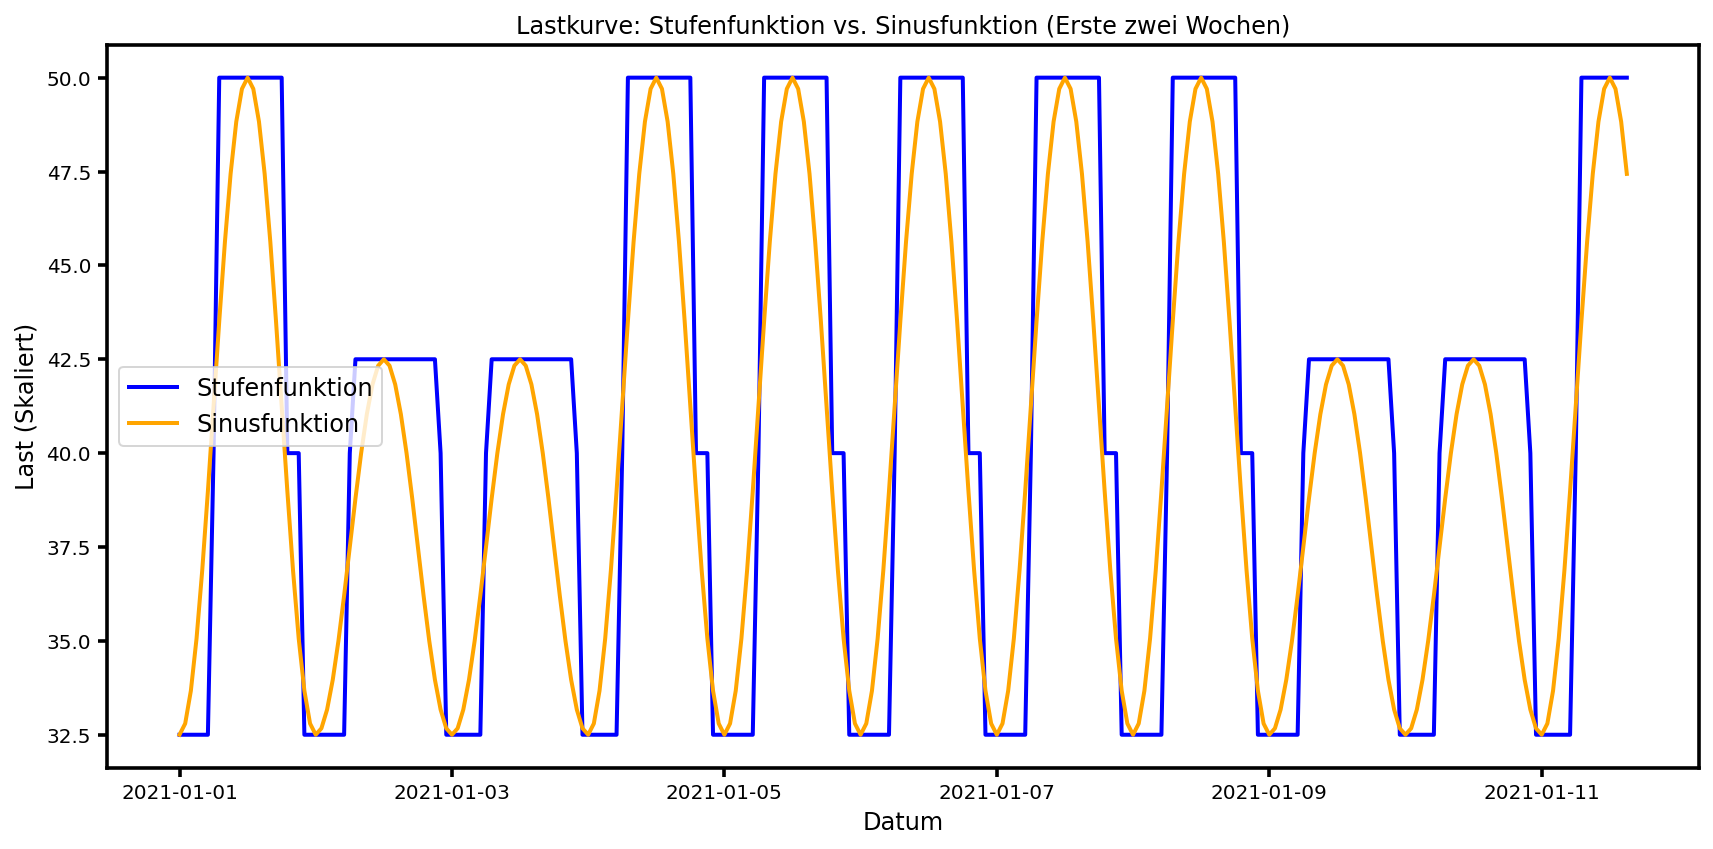
Load Curves
The load is estimated by default as a function of day and season. The exact values can be changed. The season dependence is a cosine with a max in January, a min in July, and an Amplitude A, which can be changed, of 0.05 (=5 %). 1 is added to the cosine, so it varies between 105 and 95 %. In addition at weekdays the maximum is 100% between 7 and 19 o’clock. It drops to 65% at midnight and rises from 6 o’clock again. The weekends the maximum value is 85%. All these values can be changed.
Here is an illustration for a few days:
Residuals
If not selected otherwise (normalization =False), by default all residual curves will be scaled by the (initial) absolute mean value of the negative residuals. This should make a comparison of storage size in energy hours easier. The idea is that the mean negative residuals would be what could be stored on average.